Learning Analytics: Diamonds in the Analytics Rough
Learning Analytics: Christopher Moore and Ronald J. Kantor – 5/11/11, Via Chief Learning Officer – clomedia.com
With a few relatively simple data techniques, learning leaders can access a treasure trove of meaningful learning analytics on workforce readiness, efficiency and impact.
 Data rich, information poor: It’s one of the universal shortcomings of off-the-shelf learning and talent management systems. Even though these systems are vital to the strategic alignment, readiness, compliance and operational efficiency of the business, they rarely give clear and useful insight about key initiatives using their built-in reporting.
Much learning and talent data remain trapped within expensive systems that were meant to provide answers to critical questions about effectiveness, efficiency and impact. Organizations with hosted learning systems probably feel this pain more acutely because the data seem even further from their reach. With the lack of reports provided by these systems, an obvious solution is to find alternative ways to tunnel in and mine raw data. There’s got to be valuable information that can be obtained through better analysis and more readily available output. How can organizations identify and mine the most useful findings from the data — the precious diamonds in the rough?
Learning systems are full of nifty little models and capabilities that can help answer questions about readiness, alignment and value. If an organization is only using its system to publish a catalog, register and deliver training and track completions, it might be inadvertently limiting the potential value of the system. It’s time to dust off some of the advanced capabilities of that learning system and show just how much value the learning and development organization adds to the enterprise. Do this by providing upper management with strategic information in a timely fashion.
For example, most learning systems support development plans, a list of learning activities intended to build competency around a particular job role, organizational segment or enterprise behavior such as compliance. Leveraging the development plan model within the system is key to measure workforce readiness and speed to readiness.
Assessing Workforce Readiness
Workforce readiness tells how prepared an organization’s resources are to execute the mission or strategy based on prescribed training. Start by defining development plans for upcoming training initiatives, then sequence the corresponding training requirements needed. Once the plans are associated with the intended audiences, the foundation is laid to measure workforce readiness.
To keep it simple, collect two metrics — percent complete and percent progress — and average the results to produce a basic readiness indicator. Percent complete is a simple calculation of all those who have completed the required activities of the development plan divided by all those assigned to the development plan multiplied by 100 (number of students completed / number of students assigned x 100).
If the system doesn’t record a physical amount when the development plan is complete, simply add the distinct number of required activities included in the plan plus the distinct number of required activities completed for each assignee. Compare the two numbers. If the number of those who have completed required activities equals the number required, then that student gets counted as complete. For percent progress, add the total number of completed plan-related training activities for those assigned, then divide that total by the number of training activities in the development plan multiplied by the number of assigned persons, multiplying the result by 100 [(total plan activities completed) / (number of activities in plan x number assigned) x 100]. The numerator and denominator for both of these metrics can scale up and down based on the assigned audience to produce an organizationwide metric or any defined level in between.
When it comes to learning, many have said that content is king. For learning measurement, context is king. By contextualizing the strategic initiative defined in the development plan, the model brings clear meaning to the completion and progress metrics and provides insight into what behaviors or processes need to change.
Need for Speed
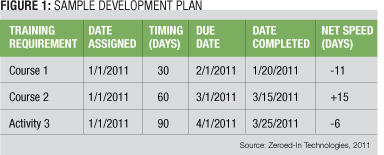
Speed to readiness tells how quickly subjects can be prepped to execute a mission or strategy. Using the development plan approach, a timing variable for each training activity is useful to identify when the prescribed training needs to be completed based on when the student is assigned to the plan. Timing is typically an integer value representing the number of days from the date the student is assigned to the plan the training requirement needs to be completed. Using the timing variable and assignment date, it’s easy to calculate when each training requirement is due. Most systems that employ timing are intelligent enough to round dates to the end of the week or end of the month as in Figure 1. For those that do not, a self-administered due date for the training requirement is sufficient to enable this approach.
Timing and due dates help determine if the student is on schedule to complete training. They also drive accountability. As due dates pass and training activities remain incomplete, email notifications or on-screen alerts can be issued to students and managers.
In measurement terms, timing and due dates are used to calculate the net speed at which a student or group of students completes requirements within the allotted timeframe. For instance, if 90 days are allotted to complete the development plan, the calculation tells how many students on average complete the development plan in less or more days then allocated. The organization can use this assessment to increase workforce competency in key areas in less time or better understand why completion is taking longer than estimated.
Self-reported and manager-reported post-training survey results are other good sources of data to build indices that can be used to determine program funding and cuts. Isolating key questions and aggregating scores across key demographic attributes can produce valuable indices that focus on quality and performance improvement outcomes.
A quality index commonly consists of three specific question results derived from relevance (e.g., the subject matter was relevant to my training needs), application (e.g., I will be able to apply what I learned) and value (e.g., I would recommend this training to a colleague). When equally weighted, the aggregated responses indicate program quality.
A performance improvement index can be calculated by comparing the net gain or loss from the results of two questions: abilities prior (e.g., rate your ability to apply knowledge and skills conveyed prior to attending) and abilities after (e.g., rate your ability to apply knowledge and skills conveyed after attending). Have a common scale for the questions slotted to be aggregate and consider using an even number of points on the scale to eliminate the neutral factor. The results will be more honest and accurate.
Learner feedback from courses or programs that reveal low-quality and low-performing programs may be candidates for cuts or root cause analysis to determine why the course is being rated poorly. Depending upon the importance of the content being taught, the organization might redesign or require updating or maintenance. Courses with high-quality ratings or high-performing programs may become examples that can be used as models for the next generation of content development.
Integrating Disparate Systems
Extracting meaningful data from a single system is challenging enough. So what’s an organization to do when aggregating disparate data from multiple learning systems? At the U.S. Department of Defense (DOD), the Intelligence Training and Education Board (ITEB), a collaboration of learning executives from the participating intelligence commands, is defining standards to enable meaningful and efficient aggregation of training activity, assessment and accreditation data. These data need to be aggregated from disparate systems across the various intelligence commands for the annual reporting process, which produces summary metrics in a formal report for the Under Secretary of Defense for Intelligence. Ensuring this effort is efficient is important, but ensuring the results are meaningful is paramount.
“Synchronizing our efforts on training, accreditation and reporting standards throughout the enterprise will enable us to build the capability and capacity to efficiently and effectively serve the intelligence community,” said A. Reese Madsen, DOD Intelligence chief learning officer and chairman of the ITEB.
Led by Benjamin Cumbo of the National Geospatial Intelligence Agency, ITEB has been investigating how to aggregate disparate evaluation data using a thematic approach that maps similar survey questions to common themes and keywords. Because many of the intelligence commands use different evaluation tools and instruments, adopting a standard set of evaluation questions in the near future may not be practical or even possible. But without some commonality, the ability to aggregate evaluation results across the commands is virtually impossible.
By mapping existing question responses in an evaluation instrument into an appropriate theme — such as relevance, quality and perceived value — based on defined keywords that appear in the evaluation question, each command can report the data in a manner that supports aggregation into indices that help the intelligence training and education enterprise as a whole determine how well they’re doing with their initiatives.
If an organization’s learning system is externally hosted and the data reside on someone else’s servers, the simplest approach is to request a snapshot of the database on a weekly basis, even nightly, if more current reporting is needed and the production system is inaccessible. One also can configure a virtual private network to allow access to the remote system and services as if they were part of a local network.
Because the objective is to gain access to the reporting system’s underlying database, it’s likely the vendor will take a database snapshot and provide a reporting instance. They typically find creating the snapshot to be less risky than providing direct production access. With either approach the data are usually at least one day behind production, but that’s a trade-off most organizations can live with to gain access to their raw data. With data access granted, a data dictionary and entity relationship diagram for the system will provide a map to reporting treasures.
A few simple techniques can go a long way to turn learning and talent data into meaningful metrics and strategic indices. As learning leaders, diamonds uncovered through measurement and the difficult questions they answer can impact the acquisition of an organization’s knowledge — a key competency to compete in today’s dynamic environment.
Christopher Moore is president and Ronald J. Kantor is senior learning architect and evaluation strategist at Zeroed-In Technologies. They can be reached at editor@clomedia.com.
http://clomedia.com/articles/view/diamonds-in-the-analytics-rough/1
To Discuss how these Solutions will add value for you, your organization and/or your clients, Affinity/Resale Opportunities, and/or Collaborative Efforts, Please Contact:
Tom McDonald, tsm@centurytel.net; 608-788-5144; Skype: tsmw5752
![]()